Dashboards & analytics
Decisions from the sealed numbers
KAI's dashboards read the same sealed records the statutory vault keeps, with approved corrections already resolved, so the number a GM quotes in the morning meeting is the number the auditor would find.
And where a figure is an approximation or a feed isn't connected, the screen says so. An audit-grade product doesn't get to decorate.
One source of truth
Dashboards read the same sealed records the statutory vault keeps, not a parallel reporting store.
Malaysia built in
Demand bands are computed over the real Malaysian holiday calendar, with your own occupancy history alongside.
Honest by design
No connected feed, no number: a panel without real data says so instead of decorating the screen.
A demand calendar that knows Malaysia
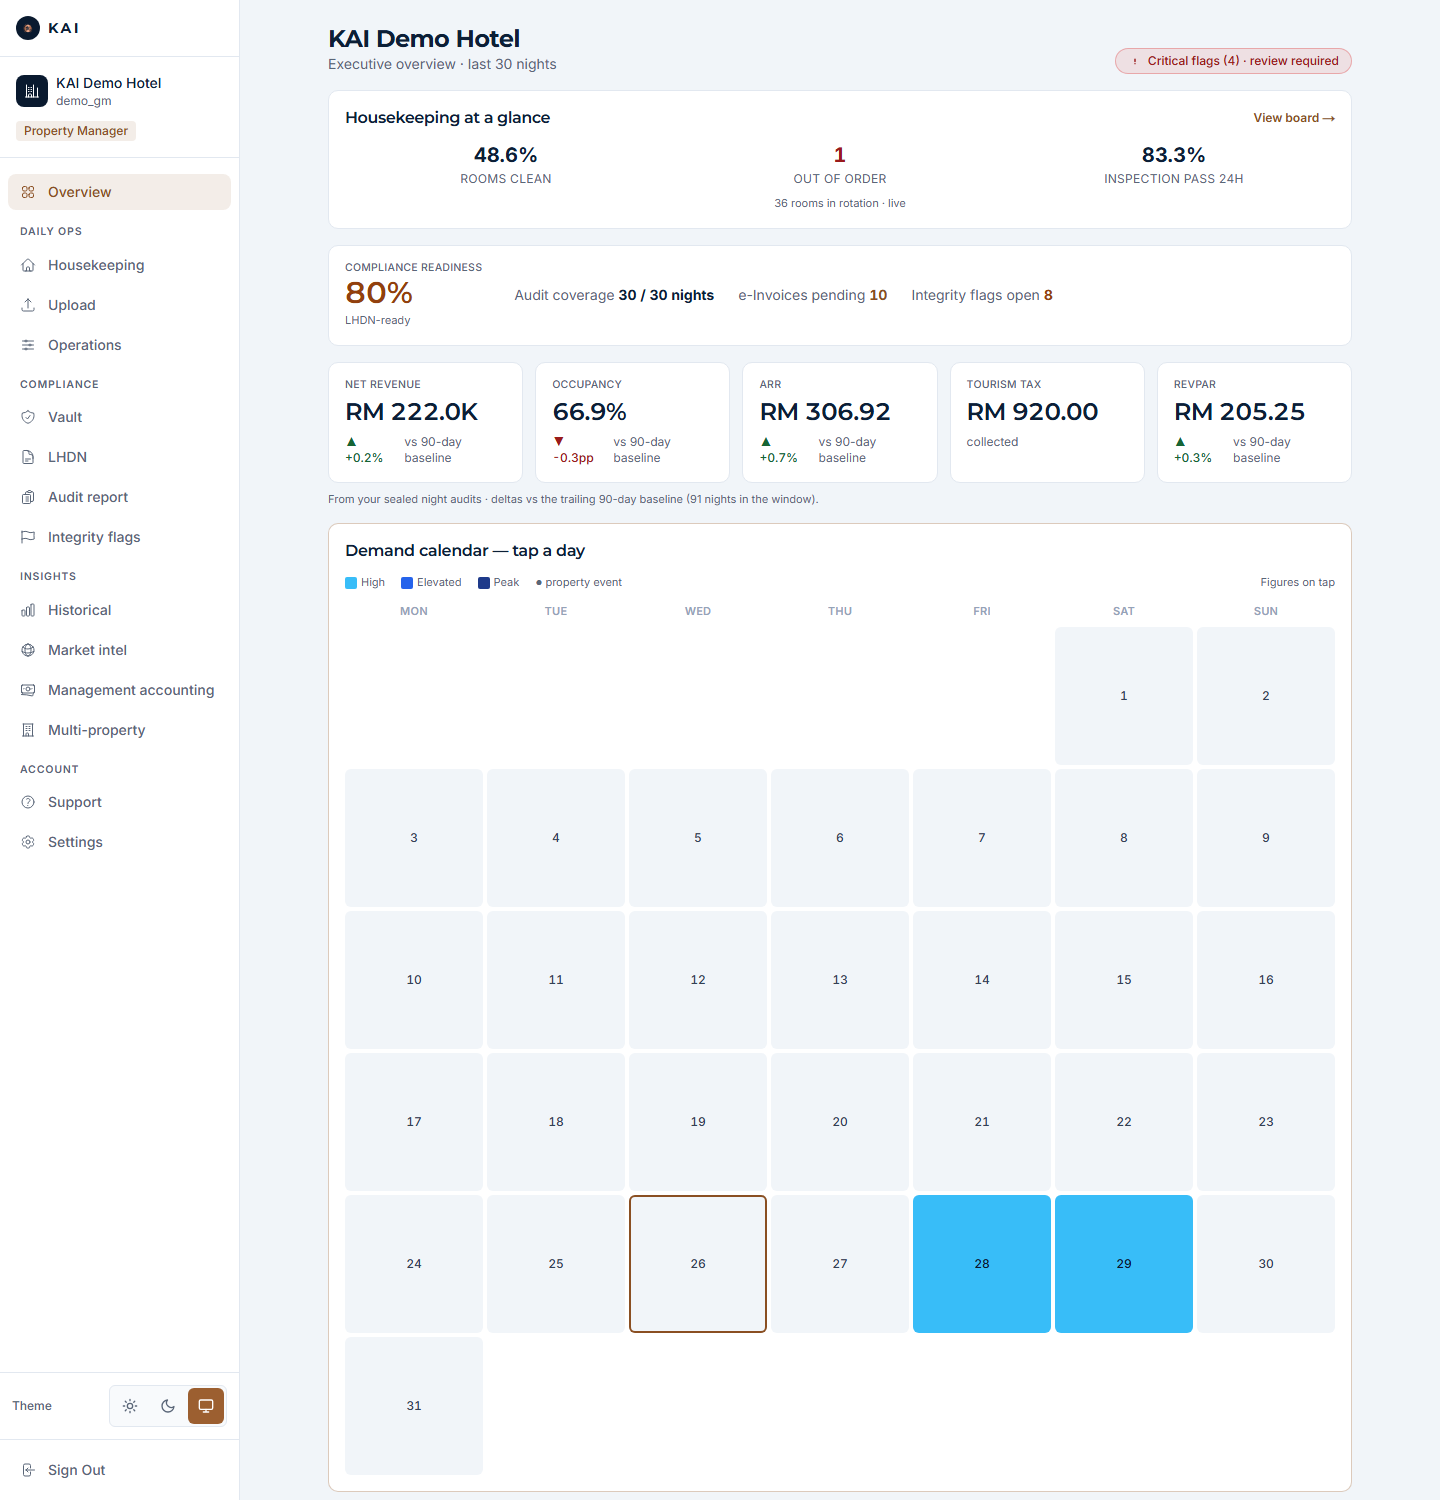
The calendar is the dashboard's centrepiece: every day carries its demand band, computed from the weekday and the public and school holiday calendar, with your own day-of-week occupancy baselines alongside, so the nights worth repricing stand out before they arrive.
- Public and school holidays built in, each day paired with your own day-of-week occupancy baseline
- Year-on-year heatmap with day drill-in: revenue, occupancy and the year-on-year revenue delta for any date
- Elevated-demand days marked as explicit price-up candidates
Revenue leaks, quantified in ringgit
The margin killers hide in commissions and quiet rate changes. KAI computes the leakage from your own documents and puts a ringgit figure on it. Not a score, an amount.
- OTA commission checked against your contracted per-channel rates
- OTA statements reconciled against the night audit, so an overcharge surfaces as an amount to recover
- Rate-spike and amendment-rate signals straight from the audit trail
From P&L to guest mix, without a data team
The analyses a group controller would build in spreadsheets, computed from nightly records that are already verified, and exportable when you want to take them elsewhere.
- USALI-style P&L: GOP, NOI, TRevPAR, GOPPAR, CPOR
- Length-of-stay and booking lead-time distributions, anonymised with a K=5 floor
- Nightly and monthly metric series exportable as CSV or JSON for your own BI
Everything in the analytics layer
- Executive overview
- KPI strip against a 90-day rolling baseline, revenue and occupancy trend, the calendar as the hero, and a state-aware compliance verdict.
- Demand calendar
- Per-day demand bands over the Malaysian public and school holiday calendar, shown with your own day-of-week occupancy baselines.
- Year-on-year
- Paired-month comparisons and a day-level heatmap; tap any day for that date's figures and its revenue against last year.
- OTA commission tracking
- Effective commission per channel versus your contracted rate. The difference is the leakage, in ringgit.
- Statement reconciliation
- OTA statements reconciled against the night-audit signal; overcharges and control-total mismatches surface for review.
- USALI-style P&L
- Departmental profit and loss with GOP, NOI, TRevPAR, GOPPAR and CPOR.
- Guest analytics
- Length-of-stay, booking lead time and cancellation figures, aggregated monthly with a K=5 anonymity floor and honestly labelled scope.
- Historical & trend
- Monthly revenue, occupancy, ADR and Tourism Tax series; yearly summaries import as clearly-marked historical months so comparisons work from day one.
- BI export
- Nightly and monthly metrics as CSV or JSON, read from anonymised corrections-resolved views.
- No fabricated data
- A market panel without a connected feed says exactly that. KAI never renders invented competitor rates.
See your own numbers with the working shown
Bring last month's reports. You'll leave knowing what your own numbers say.